The global environment is changing due to a confluence of factors underpinned by the COVID-19 pandemic and its different variants, supply-chain dislocations, the Russian war on Ukraine, and the start of monetary tightening policy due to the onset of inflation. Investment and trading activity is impacted, creating more interest in options data as it expresses the market implied, forward-looking view of the events – an alternative source of information that can be distilled into features used by automated and discretionary systems in the financial field. Earnings data is valuable due to its impact on stock dynamics and the ways it can be exploited. SpiderRock Gateway databases of historical options data such as stockclosemarks, optionclosemarks, and their intraday counterparts allow for the construction of event-driven insights based off:
- constant maturity ATM implied volatility, historical volatility, and skew
- option and stock flow data: open interest, traded volume, trade direction, market imbalances
- implied volatility theoretical surface, Greeks, and theoretical option values
- models of earnings moves: historical and implied models
Note that most of the datasets and metrics mentioned can be visualized using the new chart tool developed by SpiderRock, and the signals and features are pertinent to both practitioners, such as option and equity-focused firms and retail partners, and academic and research groups.
Questions to Ask When Analyzing Earnings Data
One type of study is to look at how the implied earnings move, denoted by the absolute return value, is related to the realized value. This dependency can be used to either develop predictive regression models or to feed the move feature in more complex machine learning frameworks. SpiderRock datasets provide two models for the expected earnings moves: one is implied by the term structure of the ATM straddles, and one is a modification of the average move during the last nine earning events. A simple rich-cheap analysis of the market-implied pricing before earnings can be illustrated by plotting the implied predicted move against the average realized move. Below we show the plot for several names, all belonging to the financial sector and reporting within the next two weeks. In the plot, the bubble size is proportional to the traded option volume, and the color reflects how many days until the nearest earnings date:
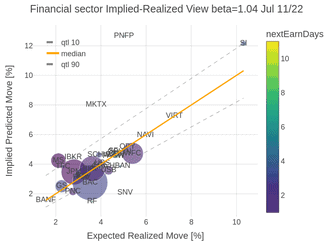
The orange, lower dashed, and upper dashed lines are regressions of the median, the 10th, and the 90th quantiles, respectively. This creates a more robust regression model predicting the region of eighty percent of the observations. We note that the Beta of the regular least-squares regression is 1.04 indicating that implied and historical moves are commensurate. Having a general view of the sector, we can focus on individual stocks. Some questions can be asked:
- Are there patterns in the historical earnings data?
- What is the correlation with other stock price data, e.g., closing prices, volume?
- What is the correlation with option flow data, e.g., traded option volume, implied volatility?
- Is the option skew predictive about the underlying equity events?
We show how to answer these types of questions by focusing on two names, JP Morgan (JPM) and Morgan-Stanley (MS), both of which reported on July 14/22. The charts below are looking at the historical implied move and actual realized earnings return with the stock close prices for JPM and MS. In the charts, the Earn Move Surprise data point is defined as the difference between the absolute earnings date return and the SpiderRock implied move model value:
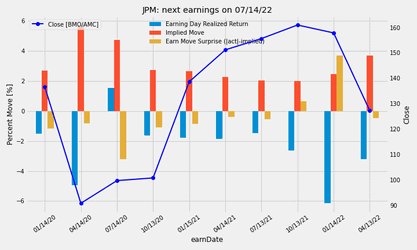
We note significance in the negative trend in the JPM earnings and the downtrend in the MS realized earnings returns. However, there is slightly more mispricing (measured by the earnings surprise values) in the latest MS earnings data on 4/14/2022. Note that both companies confirmed the downtrend in realized earnings day return of 3.5% for JPM and 0.4% for MS, with the implied model in line with previous values of approximately 3.8%. SpiderRock historical options data offers an alternative view of the earnings action. We can collect the aggregate daily option traded volume per option type (call and put) together with the normalized 21-day constant maturity skew 50-20 Delta, which is the spread between the 21-day constant maturity ATM for 50 Delta and 30 Delta. The normalized skew indicates the demand for speculative calls against more defensive positions. The results for JPM and MS are shown below:
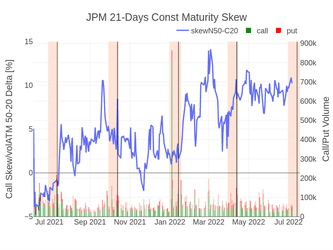
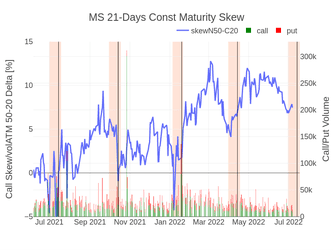
The vertical thin black lines indicate the earnings date with a region of 10 days before and 2 days after the event, while the last line is the previous earnings date on 7/14/22. We remark the overall trend toward skew steepening (positive and increasing) from 2021 to 2022, the speculative call buying in July 2021 also followed by large call volumes, and usually a flattening of the skew leading into earnings, with the assumption that increased call activity during periods of flattening or negative call skew reflects increased speculative buy volume associated with an uptrend in closing prices. Given the observations, the constant maturity normalized skew slope could be a feature candidate to further studies. Another insight into the earnings events is extracted by a conditional analysis of the cross-section Sharpe ratio (or Sortino) of the post-earning daily returns as a function of the quartiles of the pre-earnings constant maturity skew slope. The skew quartiles are labeled starting with 1 for flat or negative, to 4 for steep, as shown below:
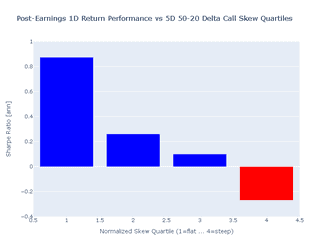
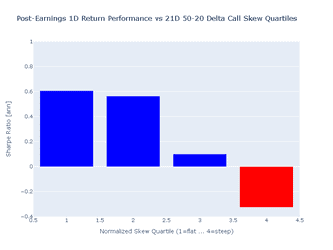
In the view above, we also test the intuitive observation that we expect a stronger directional signal if using a shorter-term constant maturity skew, which is confirmed by the higher Sharpe ratio of the flattest quartile (labeled with “1”) of the five days constant maturity normalized 50-20 Delta skew in comparison to the corresponding value shown in the twenty-one days maturity plot. These examples are illustrative, relevant, and can be easily extended with more extensive traits and analytics to be fully integrated into portfolio management, general investing, and economic and financial research activities.
Options involve risk and are not suitable for all investors. Below is a link to the OCC option disclosure document that explains the characteristics and risks of exchange traded options:
https://www.theocc.com/getmedia/a151a9ae-d784-4a15-bdeb-23a029f50b70/riskstoc.pdf
