We used CBOE end-of-data from January to beginning of April 2020, classified in two subsets based on SPX returns greater than 20 bps or lower than -20 bps and selected the corresponding returns in three macro factors, VIX, TYVIX and OVX (the last two being the VIX-like indices based on the 30 days options on 10 Year Treasury Note futures price and Crude Oil USO contract respectively – see CBOE volatility indices.). An illustrative and lucrative (trading and/or hedging wise) aspect of the market behavior during extreme turmoil is the asymmetry in behavior of correlation of macro factors during the up and downs move of the markets. Evidently market practitioners are aware of the regime difference between market rallies and market collapses, but it is illustrative to filter the behavior through the current crisis, which exhibited historically extreme market moves. Also, descriptive macro inter-correlations statistics is the first stage in identifying potential misalignments and opportunities in the markets.
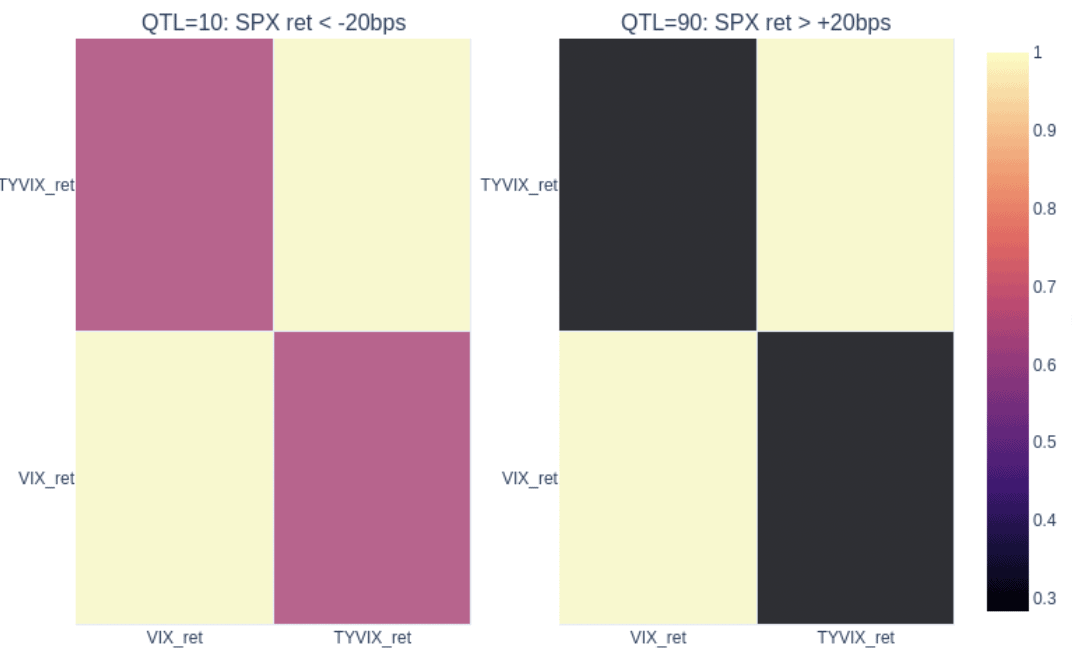
Looking at the correlation matrix of percent changes in lower and upper tail moves (in the 10th quantile of the negative SPX returns filtered subset and the 90th quantile subset corresponding to the positive SPX returns, quantiles calculated on a rolling basis) of VIX and TYVIX we note that highly positive correlation ~60% of the changes during the crash regime, which reflects the panic mode in the market scrambling for yield and protection during the period; in contrast during the rally moments (SPX returns > 20 bps) the co-dependence was much lower although still positive ( ~20%) an indication of a partial shift to risk-on action yet with continuing demand for Treasuries.

If the result for VIX and TYVIX is not completely surprising, the relationship between between the energy sector (OVX) and the SPX returns shows the correlation dislocation (strong negative correlation between OVX and SPX percent changes ~ 60% in the negative SPX returns regime vs the positive correlation ~ 24% during the rallies ) that occurred during the market crash and partially triggered (in retrospect) by the Russia Saudi-Arabia oil price war.

Note that in the above analysis the correlation measured is an average estimate mixing lead and lag effects due to the rolling quantile statistics. Although correlation, as shown, is a practical indicator and warning of market dynamics changes, an immediate continuation of the simple investigation above is to look at lead-lag effects between macro factors, approach amenable to be used in conjunction with identifying possible trading opportunities. We hope to look at these aspects in a future note.