Following up our previous blog post and focusing on earnings events, we discuss other metrics and ways in which SpiderRock Gateway’s database of historical options data, such as stockclosemarks and optionclosemarks (and their intraday counterparts), allows market participants to extract insights and perform various types of analysis.
In this post, we focus on a couple of indicators related to market sentiment, which fall in the category of contrarian views and are extracted from SpiderRock Gateway’s historical options data. These indicators represent an alternative, implied view of the complex dependencies encountered in the historical stock market data and are especially useful to characterize equities behavior around events, in particular earnings.
As mentioned in other posts, the datasets and metrics can also be visualized using the new chart tool offered by SpiderRock Gateway.
General Market Sentiment: SPX Option Volume, VIX Level, Put/Call Ratio and Gamma Imbalance
One metric useful to assess the overall market sentiment is the Put/Call ratio, a contrarian indicator that can be computed from the optionclosemarkhist data set at low- and high-resolution time intervals. The indicator is computed based off either sector data or individual names.
Together with:
- the VIX volatility index (classified as high for values greater than thirty) and
- the SPX option volume (daily value and average)
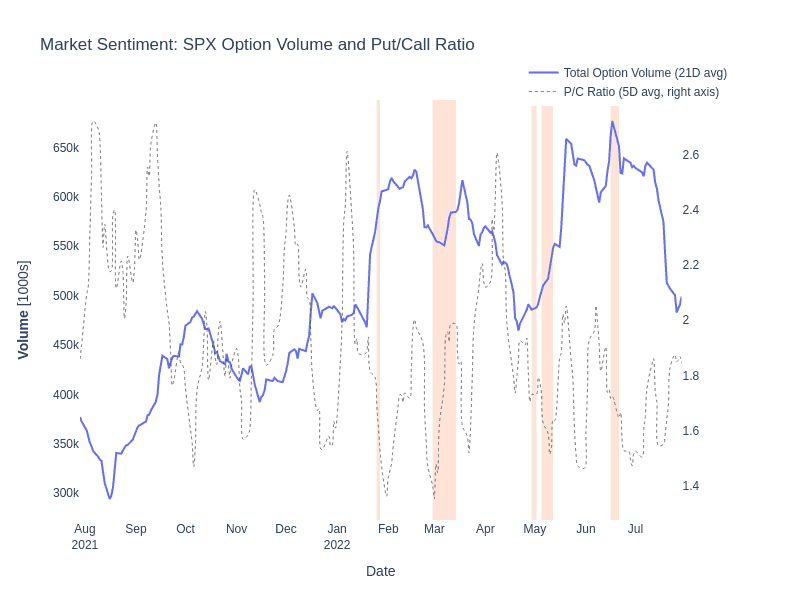
these metrics indicate the overall market sentiment environment (fear or greed). This is illustrated in the graph below, which shows SPX option volume overlaid with the P/C ratio and the regions of high VIX value denoting usually violent market moves and mini crashes.

Note the consistently high (larger than 1.6) level of the P/C ratio combined with the increasing volume of options traded in SPX and the regions of high VIX from March-May in 2022, all pointing to the increasing uneasiness of the markets toward the second half of 2022.
In conjunction with the P/C ratio, another metric that one can use in various analytics, either to characterize dealers’ positioning, option order flow structure, or to study the stock dynamics with respect to upcoming earnings events, is the P/C Gamma imbalance.
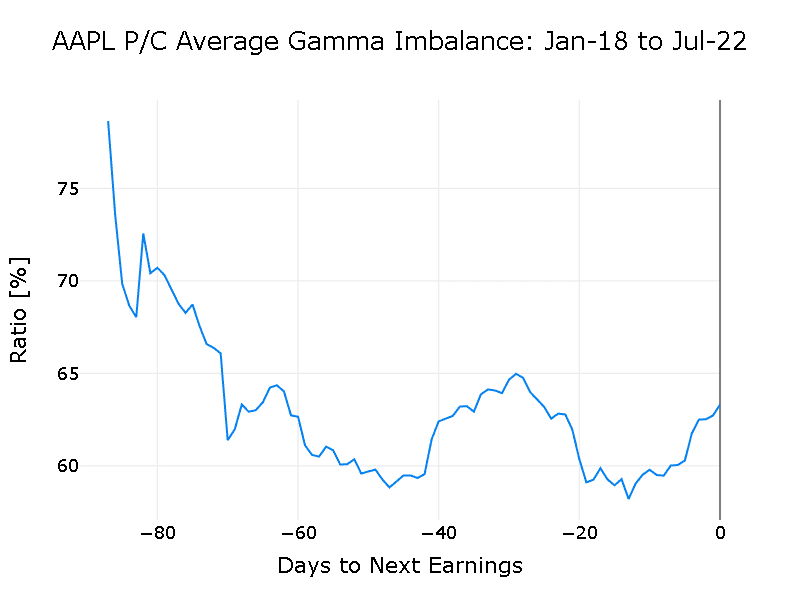
One way in which SpiderRock Gateway provides the data is by computing (either for a single stock or averaging across a set of names) the ratio between put Gamma outstanding to call Gamma outstanding averaged across a historical time period as a function of the number of days to next earnings – this dependence represents more of a behavioral insight into the market participants positioning into earnings.
Below is one example looking at Apple using the last four years of earnings. One quick takeaway is that the Gamma imbalance was skewed toward calls (the ratio tending lower) when earning events are approaching, and puts have a spike just after earnings:

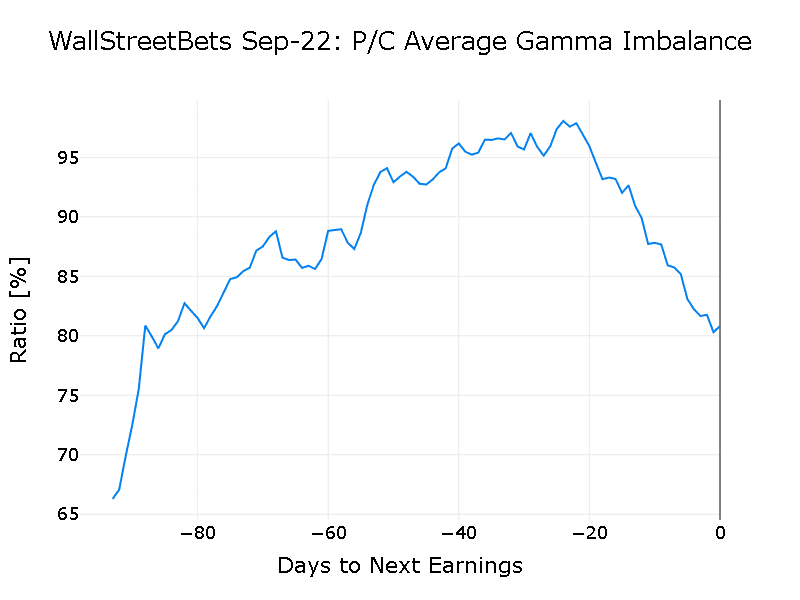
We get a different perspective–the opposite of that noticed in the AAPL result above–if looking at some of the top names mentioned in the r/wallstreetbets forum (of GME/AMC fame) e.g., stocks as TSLA, AMTD, BBBY, META, AAPL. The Gamma imbalance exhibits more of a peak in put Gamma around one month to earnings, and then an increasing call component close to earnings (we averaged the data across earnings within the last four years):

Without a further analysis and without including the order flow data that SpiderRock has available, we cannot provide deeper explanations of the noted dynamics.
The result above shows one way that the valuable class of market sentiment indicators derived from options and complementary to other types of features (price based) are provided or can be computed from SpiderRock Gateway’s historical option data sets.
