We follow up our previous blog post focusing on earnings events and discuss other metrics and ways in which SpiderRock Gateway database of historical options data such as stockclosemarks and optionclosemarks (and their intraday counterparts) allow one to extract insights and perform various types of analysis.
We will continue to explore metrics related to implied moves, which we illustrate with examples from the July 2022 earnings season. The middle of the summer of 2022 was meaningful due to the general macro environment (Ukraine war, COVID-19, monetary policy adjustments, de-globalization of world trade and politics) and, in hindsight, as a period precursor of today’s more volatile market.
The datasets and metrics we are mentioning can also be visualized using the new chart tool developed by SpiderRock Gateway.
Implied Earning Moves: Sector and Company Level
There are several metrics related to pre- and post-earnings price and implied volatility movements that are contained or can be computed from the SpiderRock historical option data sets:
- historical estimated realized earning day move.
- model of implied move based on SpiderRock baseline ATM implied volatility term structure.
- analytical approximation of market implied earnings move based on straddles theoretical prices given by SpiderRock surface.
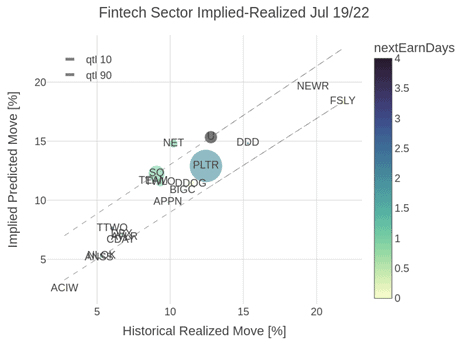
As an example, we can visualize the sector richness of cheapness by plotting the implied predicted move against the historically realized for Fintech growth names (filtered by liquidity) with earning events upcoming within five days of 7/19/2022:

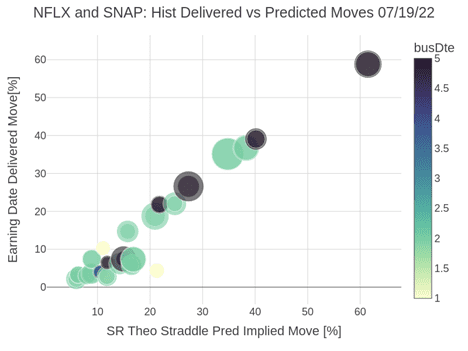
We note the quantiles regression of the 10th and 90th quantiles capturing fully the implied-realized relationship across the sector. Alternatively, we can get insights into the individual companies and build another relative value quantity by extracting–based on the theoretical SpiderRock volatility surface–the market prediction of earnings move constructed using an analytical approximation of the theoretical value of ATM straddle and the post-earning delivered stock absolute jump. Two interesting names that reported earnings in July’22 are NFLX and SNAP, and plotting the two quantities, we remark the possibly explanatory power of the SpiderRock reference option data theoretical straddles predicted move:

Earnings Day Straddle Portfolios
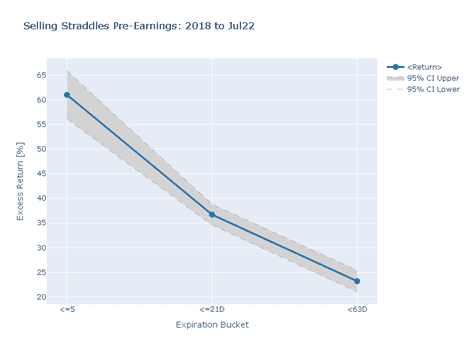
The above investigation leads to another typical question in trading, what would be the performance of diverse options strategies in different market conditions? One hypothesis one could evaluate is if options are overvalued (high implied volatility in comparison with delivered Gamma) going into earnings, especially during the current highly volatile years. We formed a portfolio of ATM straddles within one week to three months to expiration across a couple of names that reported in July’22 (NFLX, TSLA, UAL, SNAP, MSFT, FB) and assumed we sold it one day before earnings and closed it after the earnings (with earning date adjusted to the next day if the earnings press release occurred after market close). Plotting the straddle portfolio excess return and 95% confidence bands against expiration buckets:

